By The Editor and the AB Desk
Two of the desk's market-stress gauges moved toward each other for a second straight session on Oct 23. In the desk's final Oct 23 compute (3:56 PM ET), the SHC model's pressure line stood above its capacity line for the first time since the current SHC episode opened on Oct 6: S 48.3, D 49.5. The drawdown-hazard gauge, TRH, held at SEVERE for a second session, with P* at 76%, according to the AB homepage TRH line.
The finding matters because the two gauges usually diverge. When one tightens, the other tends to have slack. In the two earlier close approaches this year, in June and September, SHC moved without TRH, or against it, and its lines separated again. This time both are moving together. The Editor names the setup a perfect storm: several conditions aligning at once. It describes a configuration, not a timetable.
What the gauges measure
SHC tracks two quantities. S is capacity: the market's ability to absorb selling without a break in trend. D is pressure: how hard selling is pushing. Both are scored on the desk's scale.
The model registers a touch only when both conditions hold at the same time: S at or below 40 while D is at or above 60, according to the AB Desk SHC chart header. Low capacity alone does not qualify. Nor does high pressure alone.
TRH measures drawdown hazard. Its headline figure, P*, is the desk's estimate of how elevated that hazard is at each close. P* is sorted into rungs: ELEVATED, HIGH and SEVERE. A higher rung describes the conditions present, not what follows.
What the data show
On Oct 23 the S&P 500 ETF stood 2.47% below its Oct 6 high, according to the AB homepage SHC card. SHC state remained INCIPIENT, with no touch. For a touch from the Oct 23 readings, S would need to lose another 8.3 points and D to gain 10.5, simultaneously.
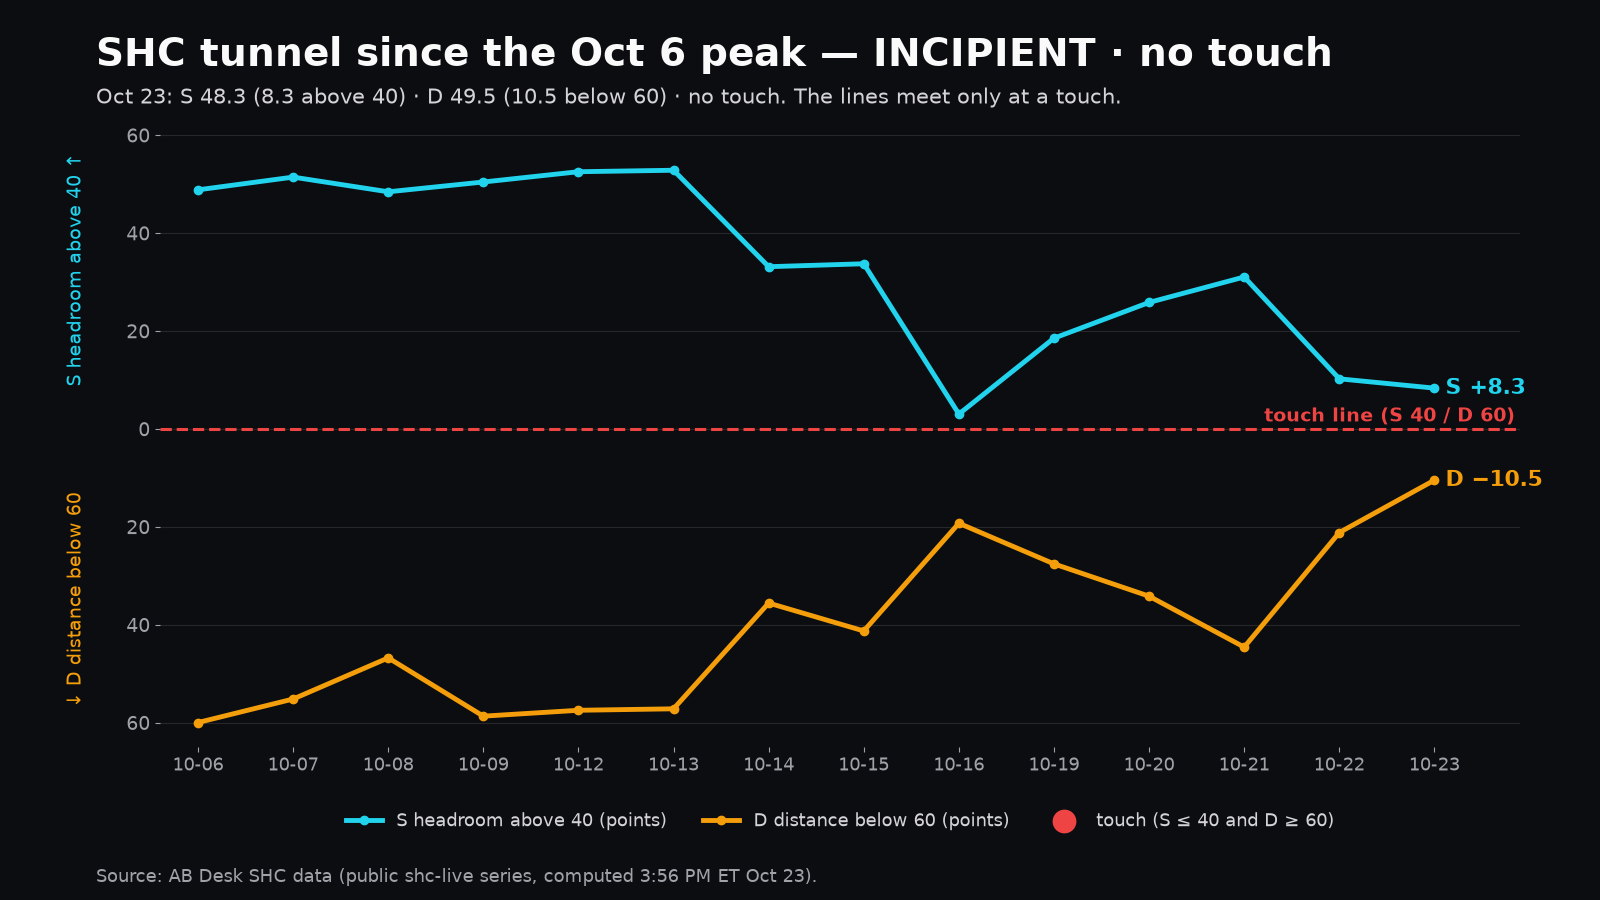
The narrowing was fast. At the Oct 21 close, S read 71.0 and D 15.4. At 5:13 PM ET on Oct 22, S read 50.2 and D 38.6, with the ETF 1.93% off the high. In that single session the gap between the lines shrank from 55.6 points to 11.6. A touch then required S to fall a further 10.2 points and D to rise 21.4. By Oct 23 the lines had crossed, with D 1.2 points above S, and the distance D must cover had roughly halved, from 21.4 points to 10.5. Crossing on the raw scale is not a touch. The SHC chart plots each line as its distance to its own threshold, so the two meet only at a touch; on Oct 23, S stood 8.3 points above 40 and D 10.5 points below 60.
The TRH climb
The current TRH episode opened Sep 4 and had run 34 sessions as of Oct 22, according to the AB Desk TRH ladder card. Across the NFP, CPI, FOMC and PCE releases, the rung moved between ELEVATED and SEVERE.
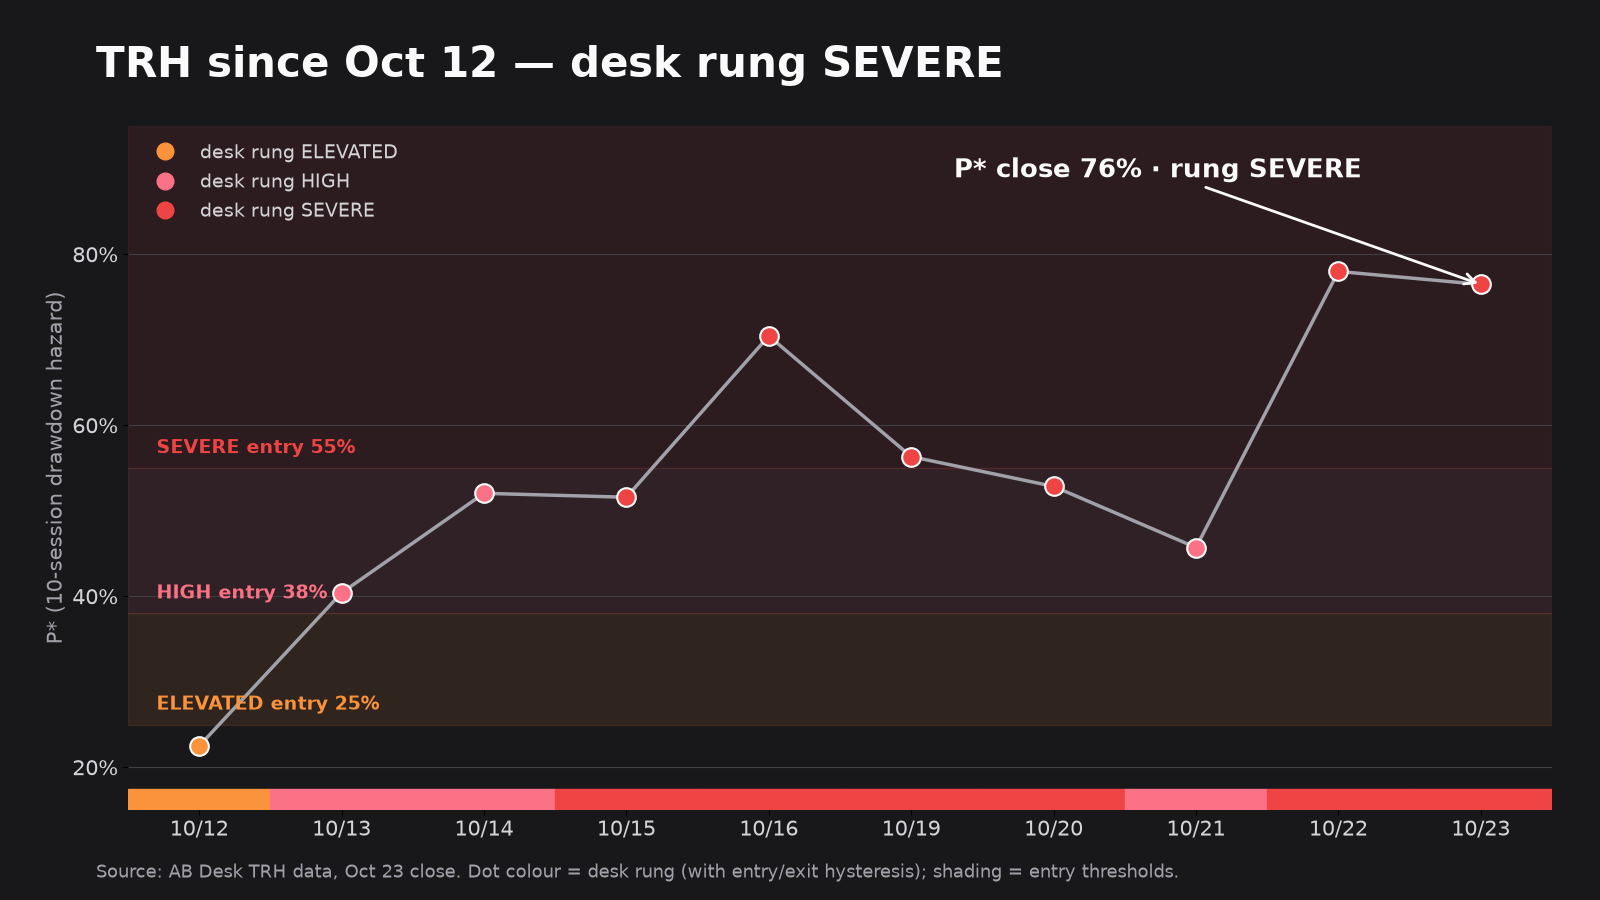
October's closing readings, from the AB public market-direction trail:
- Oct 12: P* 22%, ELEVATED.
- Oct 14: P* 52%, HIGH.
- Oct 16: P* 70%, SEVERE.
- Oct 21: P* 46%, HIGH.
- Oct 22: the desk committed back to SEVERE on a 58% intraday read. P* closed at 78%, the episode's highest close.
- Oct 23: P* 76%, SEVERE, second session at the rung, ladder direction RISING. Intraday, P* ranged between 67% and 80% while the rung held.
The path was not linear. TRH reached SEVERE on Oct 15, eased to HIGH by Oct 21 and returned to SEVERE on Oct 22. The S&P 500 ETF finished Oct 22 at 763.96, down 0.56% from the Sep 4 open of 768.28 and 2.1% below its episode high.
The comparison cases: June and September
SHC's lines came close twice earlier in 2026. In neither case was TRH moving with them.
June. No TRH episode was active. On Jun 10, SHC came within 0.3 of a touch, at S 40.3 and D 89.9. TRH was dormant, and the lines separated.
September. TRH stepped down from SEVERE to HIGH on Sep 15 (P* 0.383). SHC came closest the next day, Sep 16, at S 59.9 and D 61.3. By Sep 21 TRH had eased to ELEVATED (0.214). In the Editor's reading, SHC was converging on a hazard gauge that was retreating, and the lines again separated.
October. TRH has held SEVERE while SHC moved from S 71.0 / D 15.4 on Oct 21 to S 50.2 / D 38.6 on Oct 22 and S 48.3 / D 49.5 on Oct 23. The data show both gauges tightening in the same sessions. The Editor's thesis goes further: that this mutual movement, which he terms a harmonic convergence, removes the counterweight that let the earlier episodes unwind. That inference, rather than any single reading, is what he names the perfect storm.
What a touch would mean
In the desk's SHC model, a touch is the point where the market would be expected to correct. It would mark capacity exhausted while pressure is heavy. With TRH at SEVERE, both gauges would then be registering stress together, which neither the June nor the September episode did.
What would reverse it
Any of the following would break the convergence:
- S recovering toward its Oct 21 reading of 71.0.
- D falling back toward its Oct 21 reading of 15.4.
- TRH easing off SEVERE by a rung or more, as it did on Sep 15.
If either gauge stops moving, the pattern reverts to the single-gauge case seen in June and September.
The rest of the board
Not every gauge agrees. The desk's three-axis read after both the Oct 22 and Oct 23 closes was MARKET VALUE INTACT, TEMPORARY DIPS, low conviction, with drawdown risk SEVERE. The value axis treats the declines as temporary. The hazard and structure gauges show pressure building. The desk reports both.
The S&P 500 ETF closed Oct 22 at 763.96, down 1.18%, according to CNBC, above the desk's 762.04 line. On Oct 23 it closed at 759.97, down 3.99 or 0.52%, below that line, after trading between 758.68 and 763.47.
What the desk is watching, Oct 26 to Oct 30
- S and the 40 line: whether capacity holds above 40.
- D and the 60 line: whether pressure keeps rising toward 60 or turns lower.
- TRH's rung: whether P* holds at SEVERE or eases.
- The 762.04 line: whether the S&P 500 ETF holds it.
- The event window: FOMC on Oct 28 and PCE on Oct 29.
Sources: AB Desk TRH ladder card (episode since Sep 4, 34 sessions, Oct 22 SEVERE commit on a 58% intraday read, S&P 500 ETF vs Sep 4 open and episode high, FOMC/PCE dates; captured Oct 22, 11:28 PM ET); AB public market-direction trail (Oct 12–21 pulled Oct 22; Oct 22 close 0.7799, P* 78%; Oct 23 frozen cash close 0.7647); AB Desk SHC chart header (touch rule, Oct 22) and SHC tunnel chart, dashboard screenshot, Oct 23 (INCIPIENT, −2.47% from the Oct 6 high, no touch, S 48 / D 50); desk shc-live data (S 50.2 / D 38.6, computed 5:13 PM ET Oct 22; daily S/D series incl. Jun 10, Sep 16, Oct 21; S 48.3 / D 49.5, 3:56 PM ET Oct 23, final pre-close compute); desk TRH rung history (Sep 15, Sep 21 rung changes; desk capture ~3:20 PM ET Oct 22); desk gauges three-axis read (~4:12 PM ET Oct 22; as of Oct 23 close, read 4:22 PM ET) and intraday P* trail, Oct 23; AB homepage SHC card (INCIPIENT since Oct 6, −2.47% from the Oct 6 high, no touch, as of Oct 23 close, read 4:22 PM ET); AB homepage TRH line (P* 76% SEVERE, second session at the rung, as of Oct 23 close, read 4:22 PM ET); CNBC real-time quote, S&P 500 ETF Oct 22 close and 762.04 line (4:00 PM ET Oct 22); CNBC quote, S&P 500 ETF Oct 23 close 759.97, −0.52%, range 758.68–763.47 (read 4:22 PM ET Oct 23); the Editor's observations on SHC and TRH convergence (Editor conversation with the desk, Oct 22 evening).